IntelliJ IDEA Ultimate
Before starting: the Profiling tools covered in this post are available only in IntelliJ IDEA Ultimate (as of February 2022).
JetBrains provides two Java IDE editions. One is IntelliJ IDEA Community Edition, which is free and based on open-source code. The other is IntelliJ IDEA Ultimate, which is provided under a paid license.
Ultimate includes more features than Community Edition, and Profiling tools are one of them. For other differences, see the official comparison link below.
Profiling Tools
If you use IntelliJ IDEA Ultimate, you can use profiling features. They provide additional analysis data for your application. Features include Async Profiler, which analyzes execution behavior and CPU/memory resource allocation, and Java Flight Recorder, which collects JVM event information while the application runs.
You can also analyze heap memory from a point-in-time snapshot (Analyze memory snapshots) and monitor CPU/memory status in real time while the application runs (CPU and memory live charts).
Profiling Application
With Async Profiler and Java Flight Recorder, you can inspect application behavior. Provided views include Flame Graph (visualizes call trees with wider rectangles for higher CPU/memory usage), Call Tree (stack-call relationships), and Method List (tracks method calls or methods called by a specific method).
For detailed usage, refer to the official docs and video below. They may not cover every advanced case, but they provide the best starting point for understanding overall usage.
- Reference: “Official Docs: Read the profiling report”
- Reference: “YouTube: Profiling Tools and IntelliJ IDEA Ultimate”
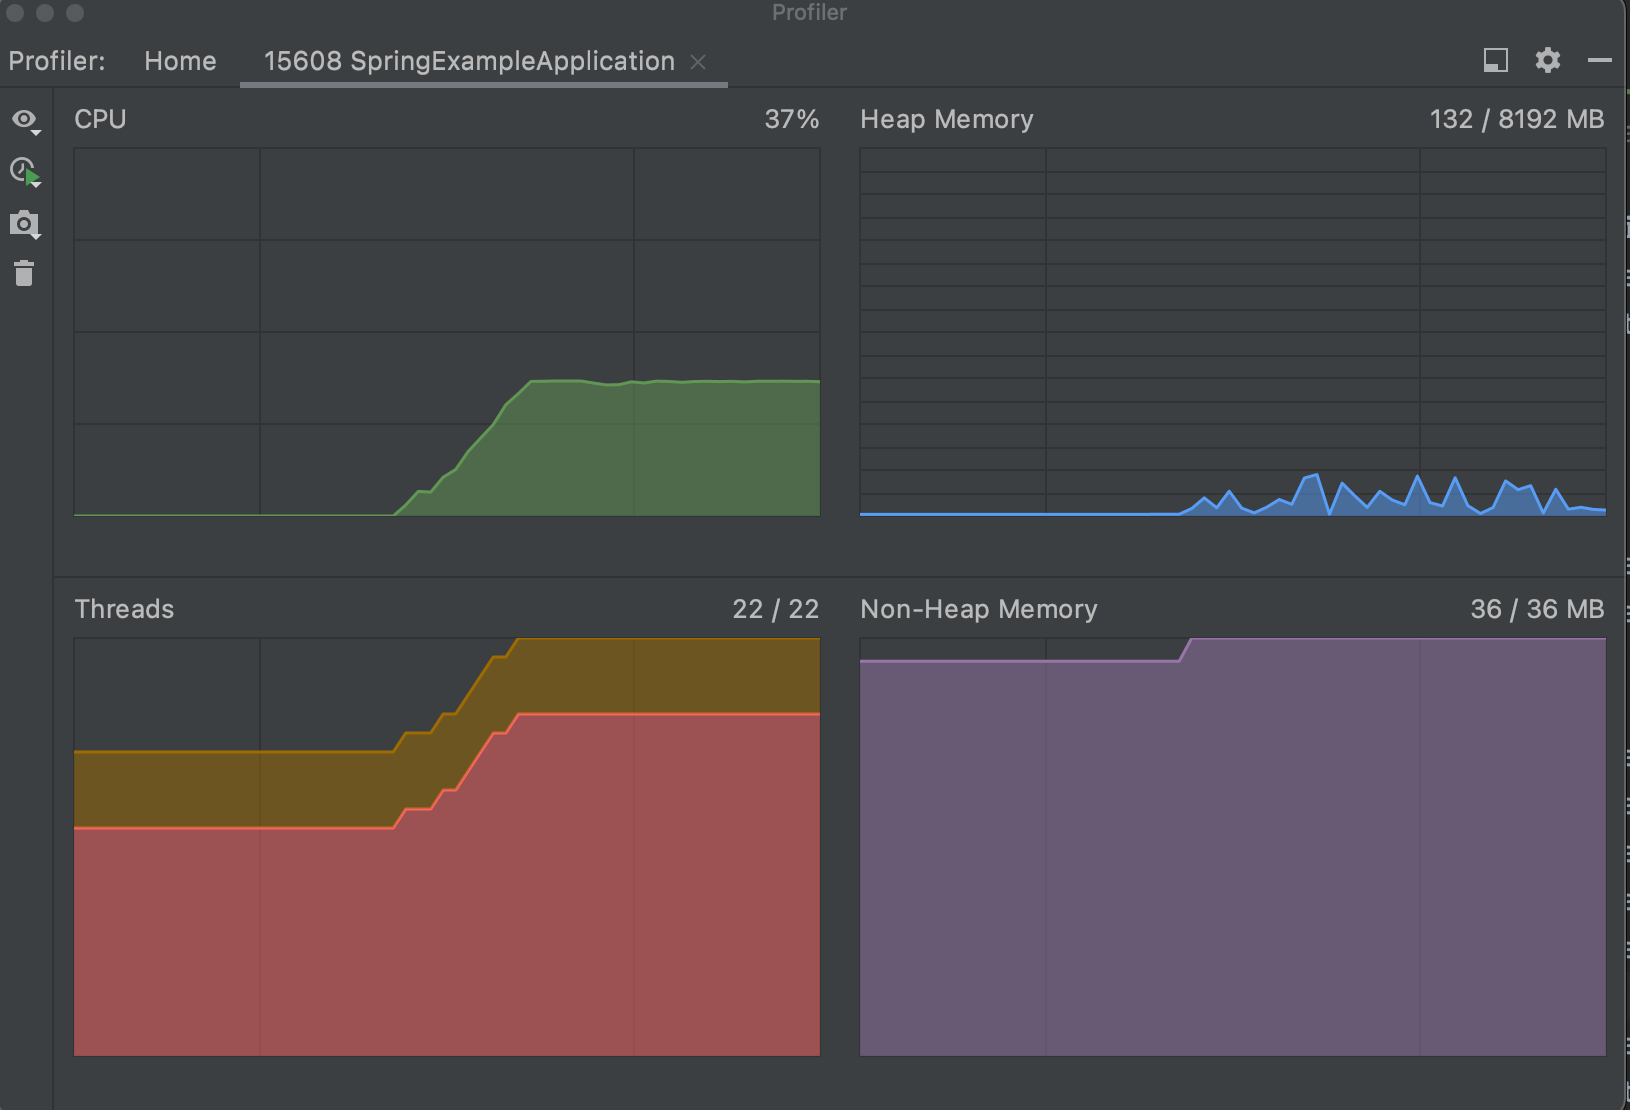
CPU and memory live charts
You can monitor resource usage in real time as charts, as shown below. You can also change the time range via options, such as all data or the last 5 minutes.
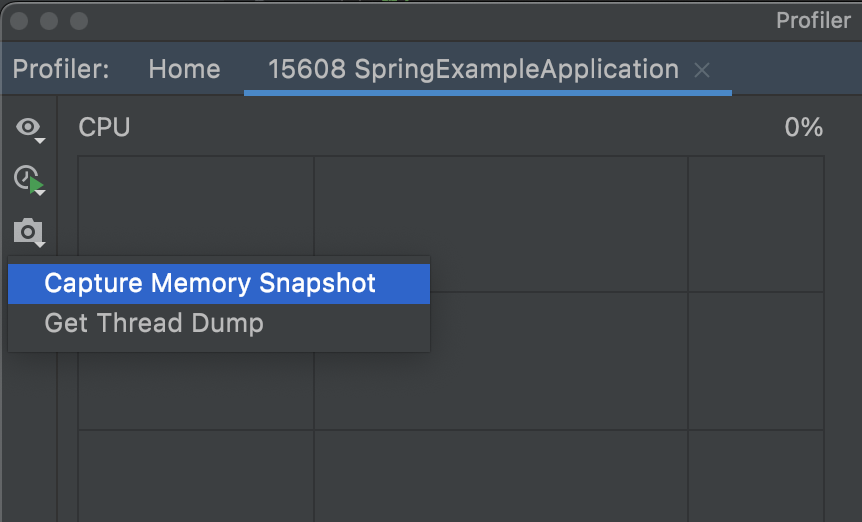
Analyze memory snapshots
With memory snapshots, you can analyze heap usage code and investigate performance issues such as memory leaks. From the live charts above, use “Capture Memory Snapshot” to dump and capture memory at that point in time.
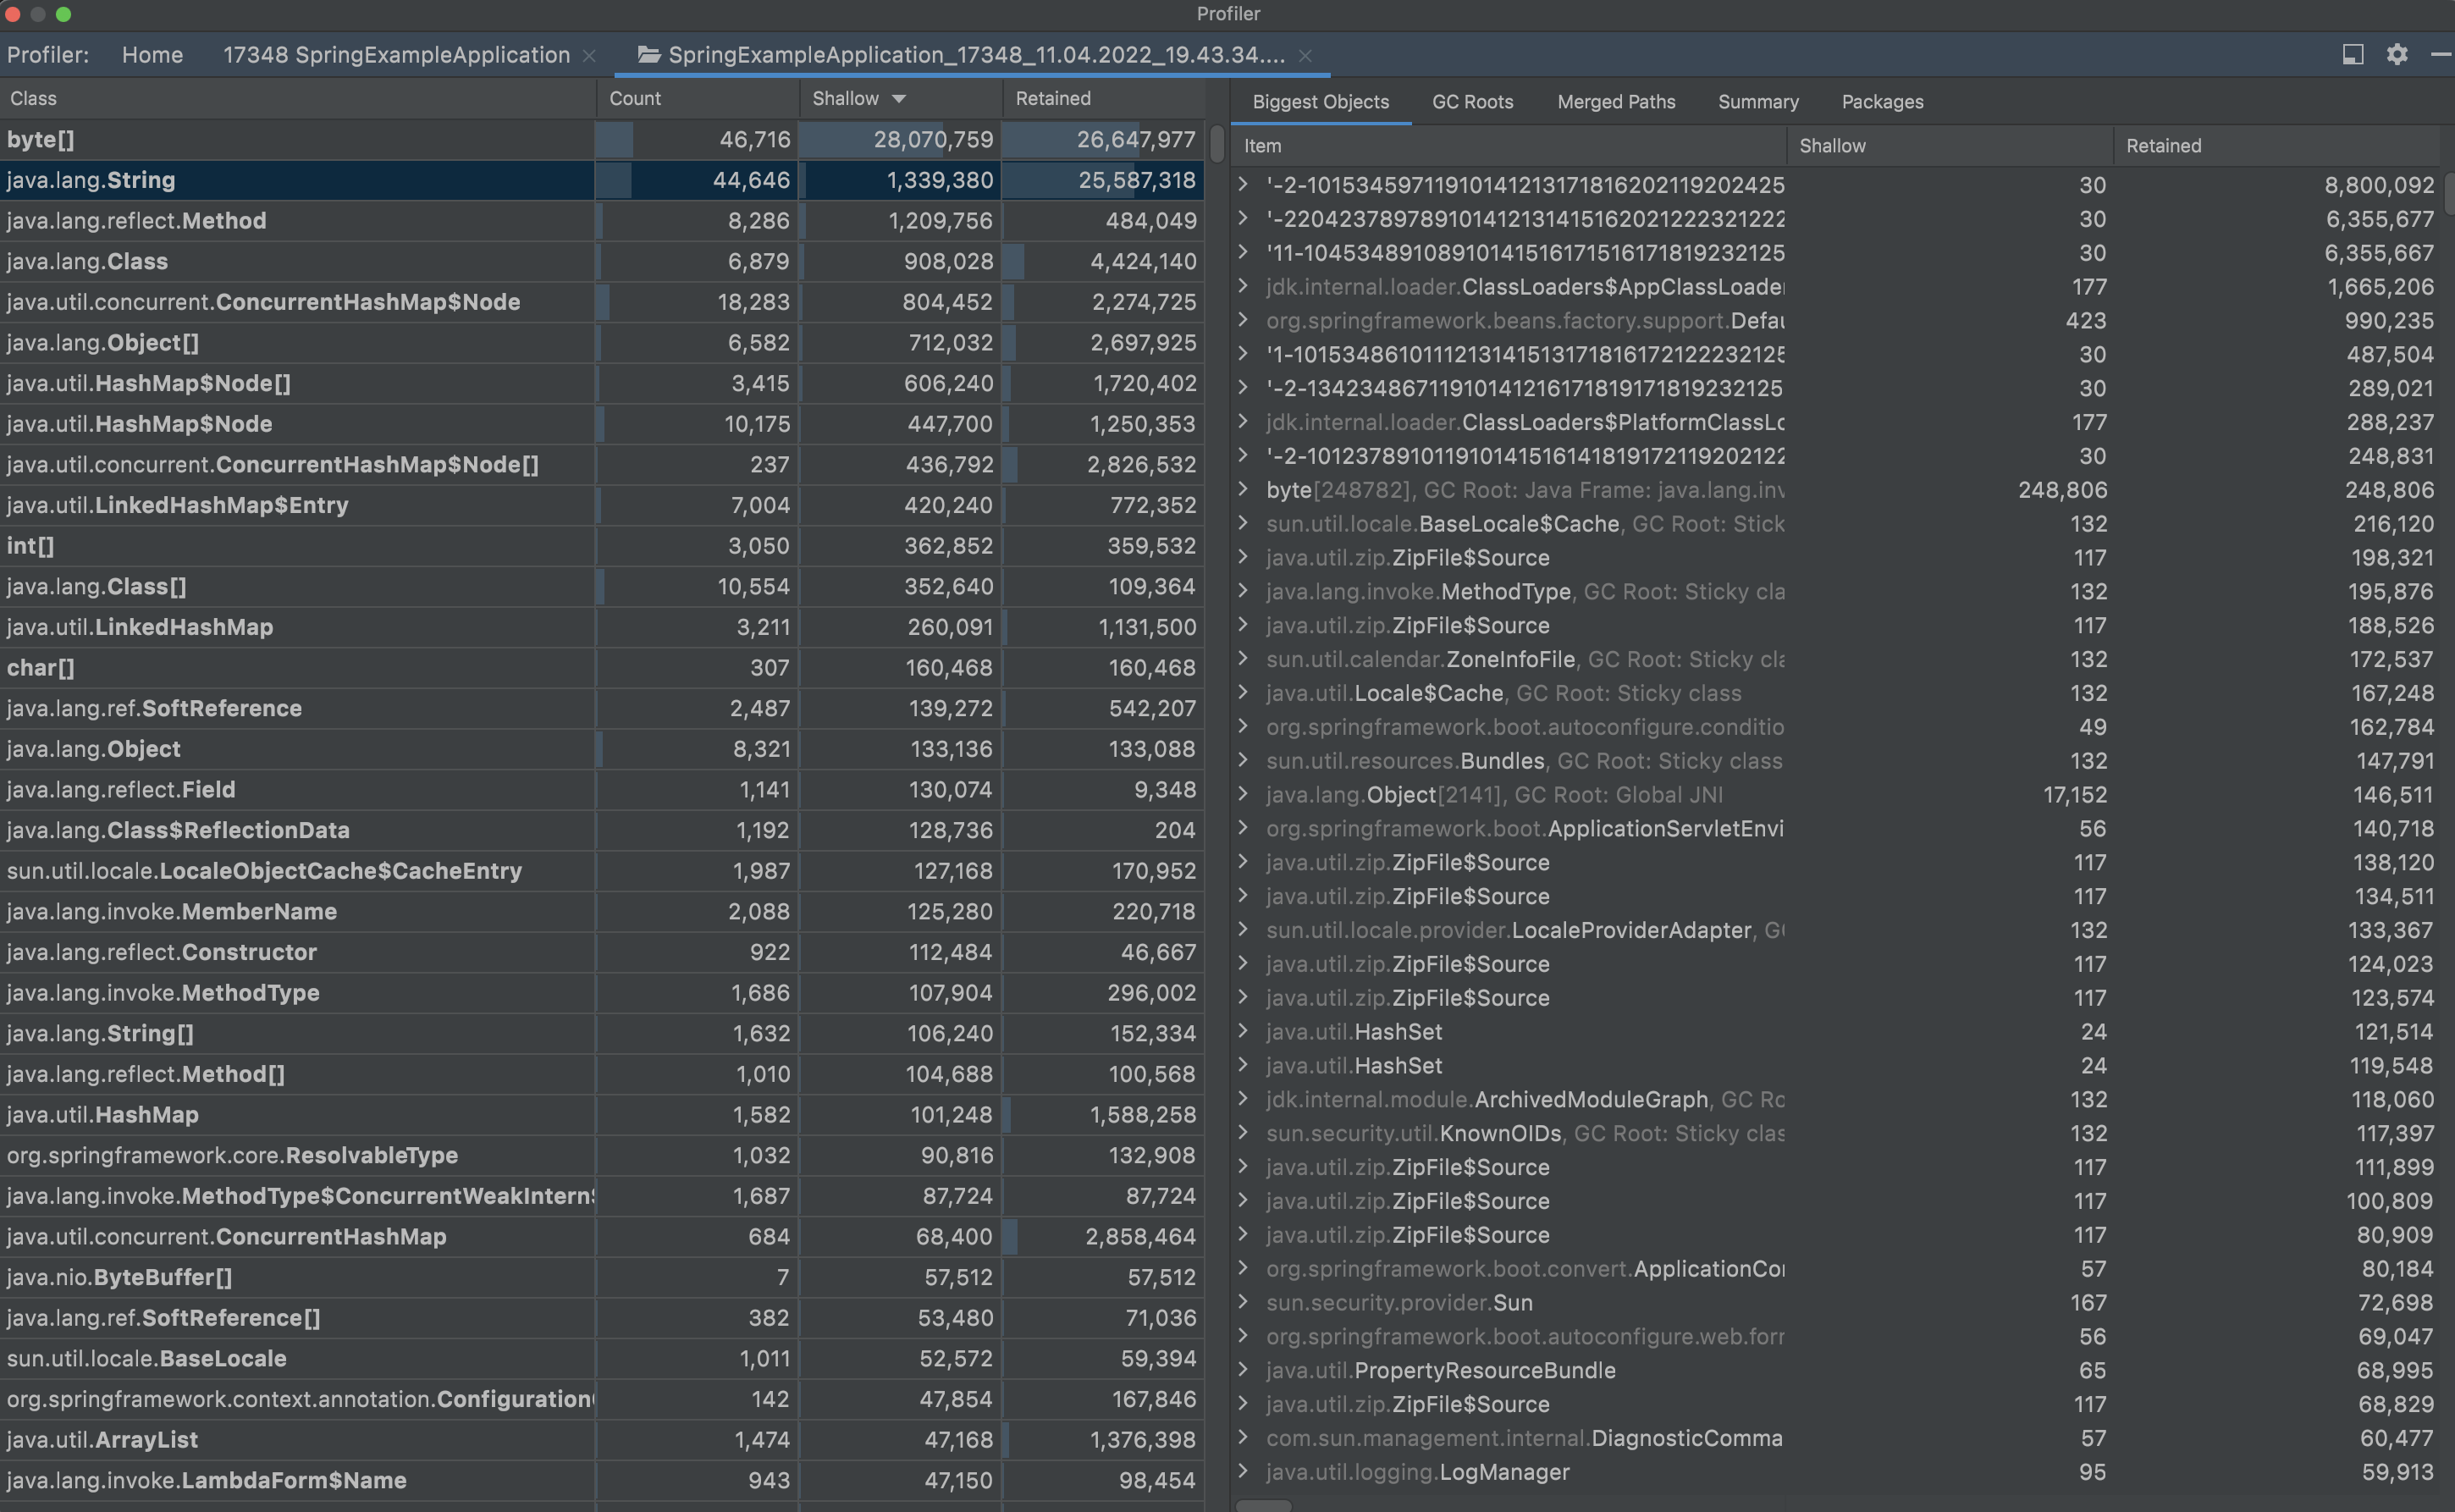
After capture, you can analyze multiple views as shown below. The left pane lists class-level memory data with the following fields:
- Class: list of classes in the application
- Count: number of instances for each class
- Shallow: shallow size, the memory allocated for the object itself
- Retained: retained size, the sum of shallow sizes for the object and all objects directly/indirectly reachable from it
The right pane includes these tabs:
- Biggest Objects: objects sorted by resource usage
- GC Roots: GC root objects grouped by class with Shallow Size and Retained Size
- Merged Paths: information such as instance counts grouped by class
- Summary: general data such as instance count and stack traces
- Packages: all objects grouped by package
Closing
Profiling is not mandatory for every development task, but it is useful when needed. This post omits many details. As also mentioned in comments under the YouTube video, some parts are hard to understand in depth. After learning this feature, I occasionally check the official guide (link), and it appears to be updated over time, likely reflecting that need.
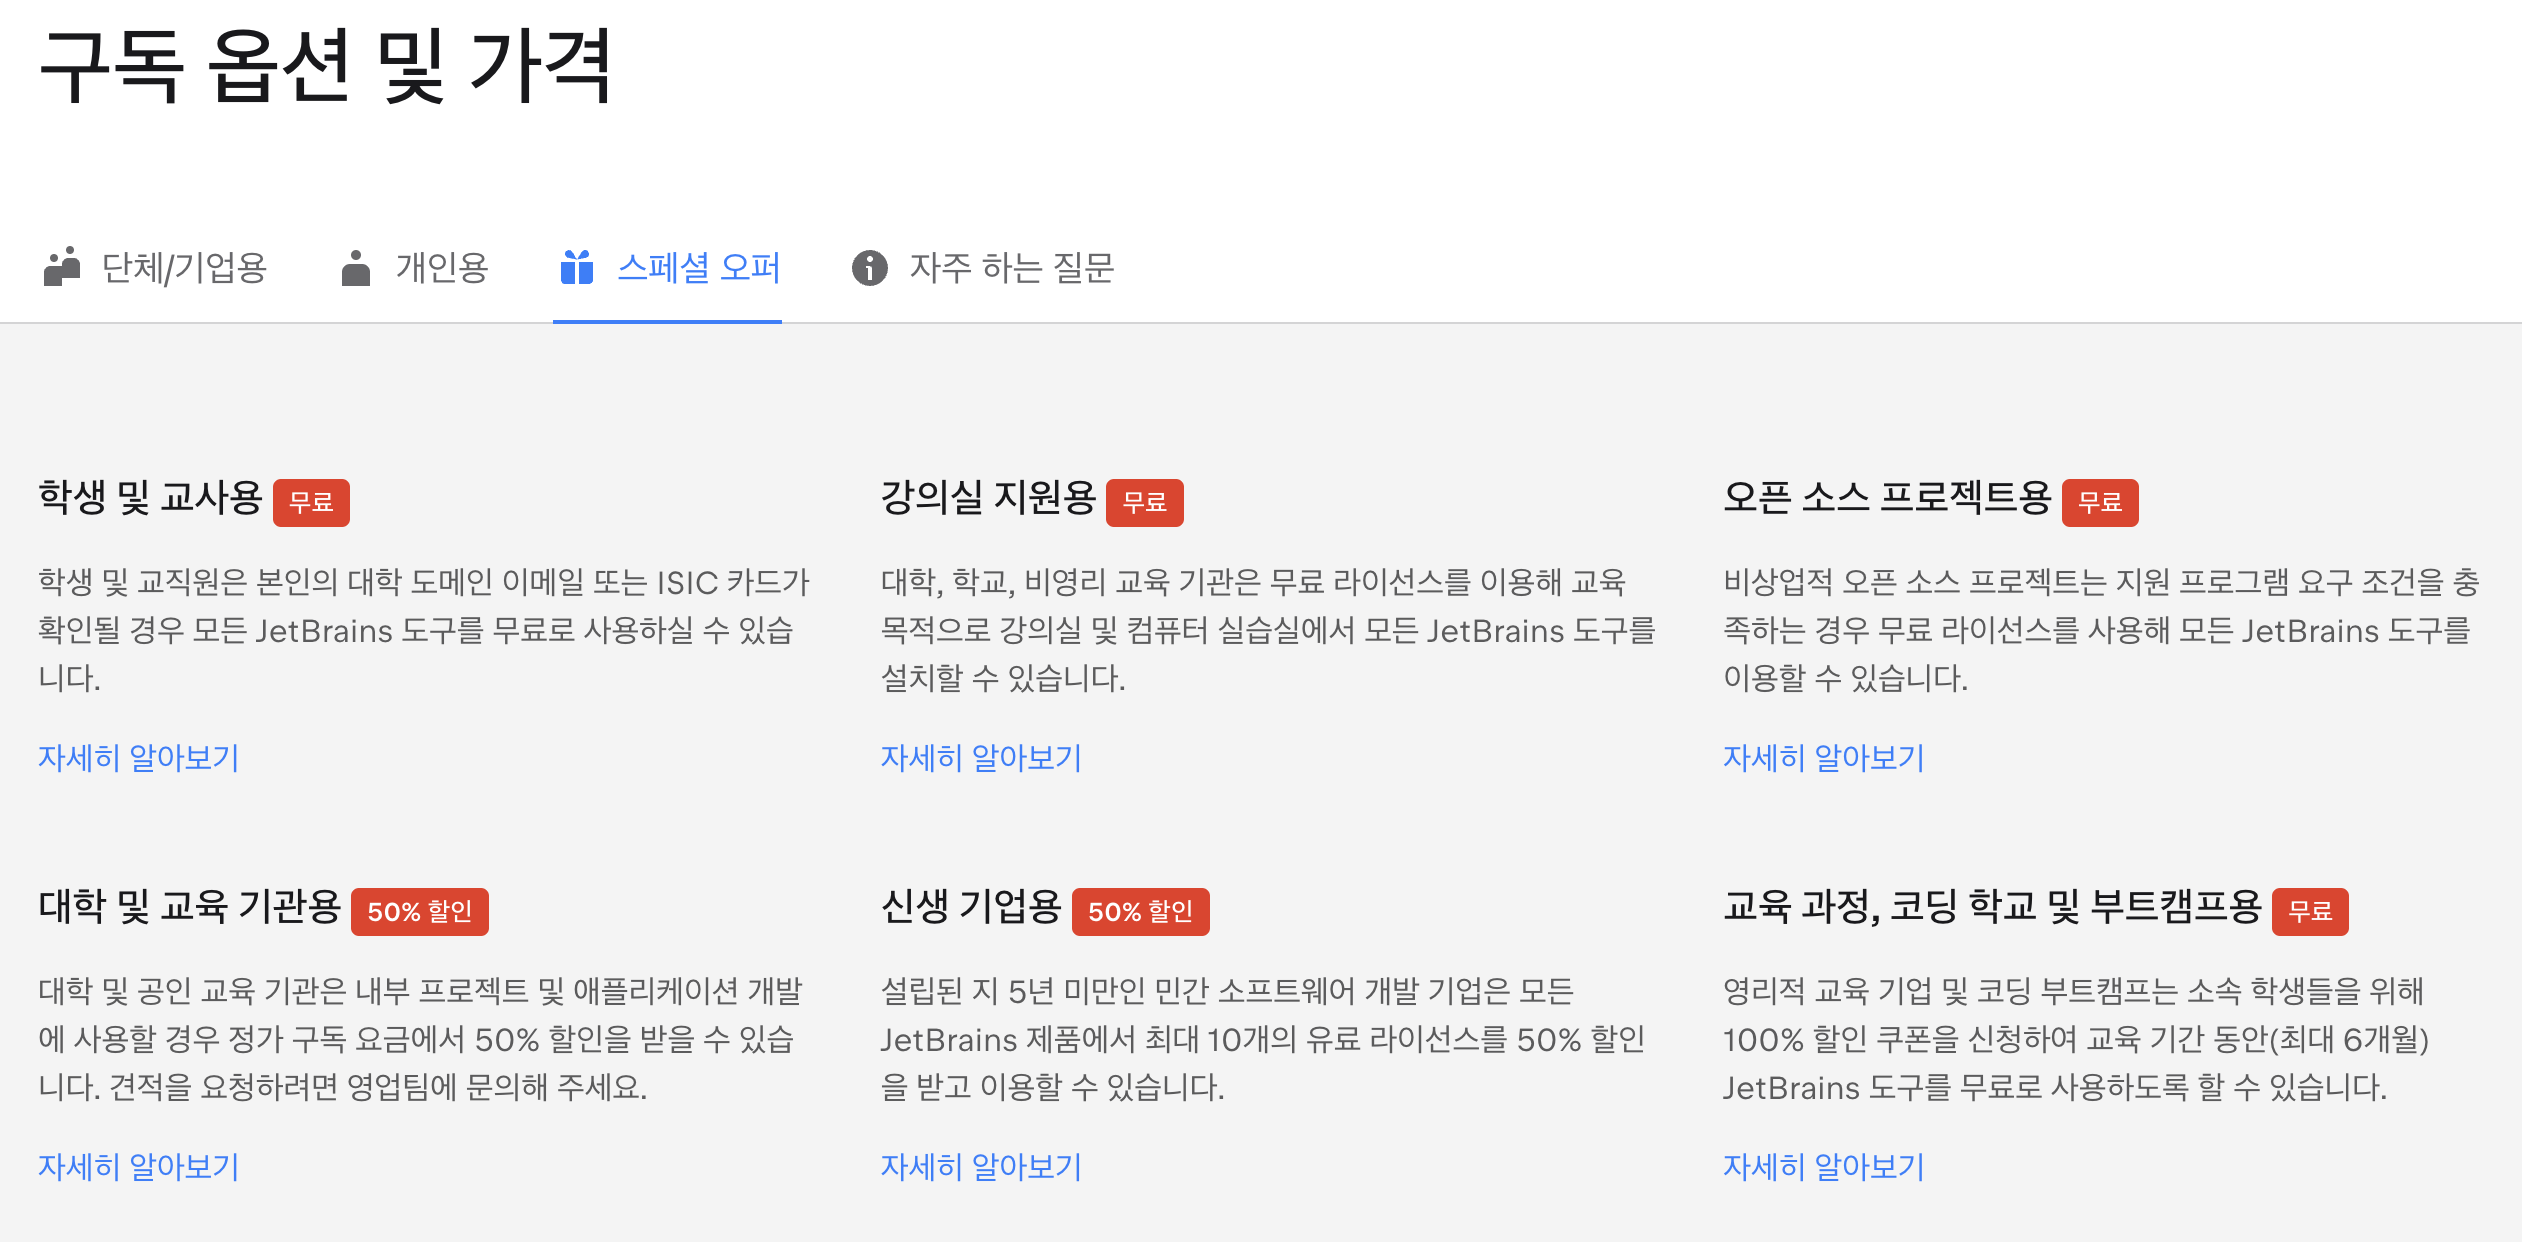
As noted at the beginning, profiling is available only in Ultimate and requires a paid license. The good part is that for non-commercial use, such as students or educational institutions, licenses are provided for free or at discounted prices. For details, see the official special offers (link).